In Step 7, you will perform the calculation and produce a report showing the relationship between load and displacement.
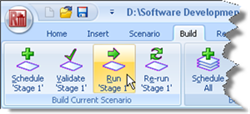
Run the calculation by selecting the Build tab on Repute’s ribbon and then clicking on the button labelled Run ‘Stage 1’.
Repute performs all the calculations that are linked to Stage 1 and then changes to its Checking Desktop (which displays the Workbook, and Graph Paper).
Your screen will now look something like the scrennshot below:
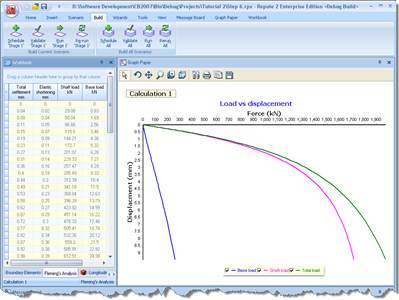
The Graph Paper panel displays a graph which is almost identical to Figure 6 in Fleming’s paper, showing:
Base load vs displacement (in blue)
Shaft load vs displacement (in pink)
Total load vs displacement (in green)
You can view the data on which this graph is based in the Workbook panel.
Step 8 - close the project